

Do you have a table chart in Superset and wondered how to add a totals row to the bottom of the table?
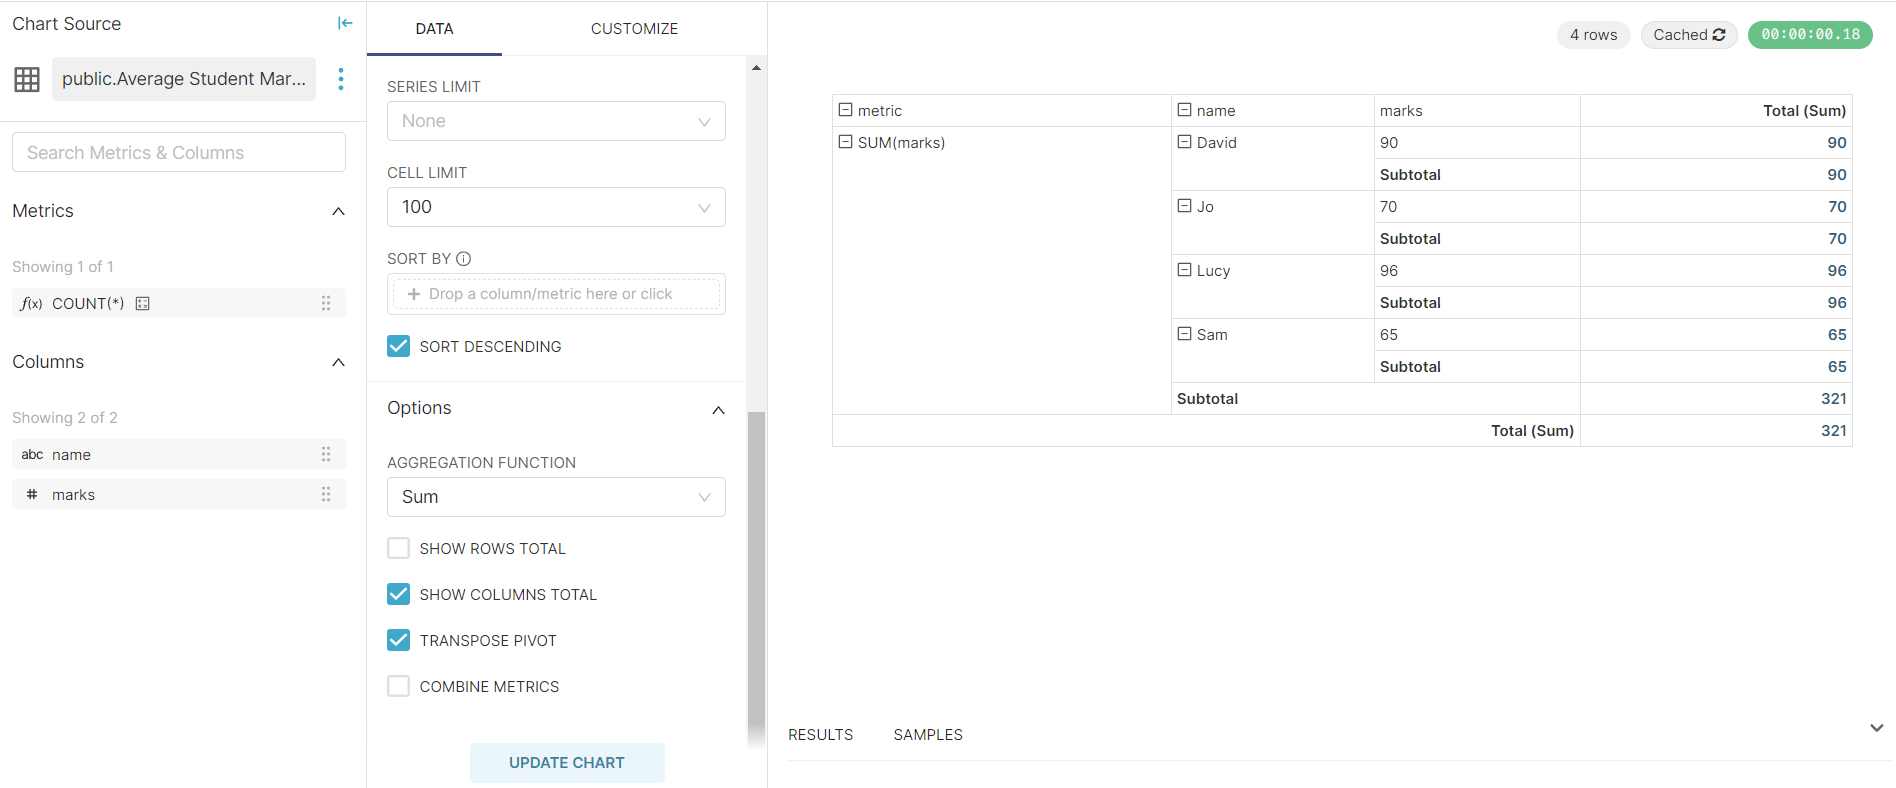
Maybe you tried the Pivot Table and its SUM options. (What’s this? Check the tooltip at the bottom of this blog.)
Maybe you did not like the sub total rows that come with it. I did not, and I couldn’t find a way to remove them and display the rows the way I wanted to.
What I needed was my own custom row and this is what I came up with and I am going to share it with you 🙂
The approach is not actually related to using some Apache Superset settings, but to simply do it purely with SQL queries!
We will take a very simple example for this demonstration.
Let’s use the SQL Lab provided by Apache Superset.
For our convenience let’s do the table creation in the SQL Lab itself but before you do that make sure to set permissions:
→ Settings
→ Database Connections (Under Data)
→ Press Edit Action in your database.
Give the following checks:

Now let’s create a table as follows;
CREATE TABLE distributed_computing (
  name VARCHAR(50),
  marks INT
);

INSERT INTO distributed_computing (name, marks)
VALUES ('Lucy', 96), ('Jo', 70), ('Sam', 65), ('David', 90);

SELECT * FROM distributed_computing;
Press RUN and you will get the following result;

Then for the exciting part;
Adding the Custom Rows!
Let’s add two custom rows. One to show the total marks and the other one to show the average marks for the Distributed Computing subject.
We are going to use a CTE as our neat little trick.

Copy paste the following code into SQL Lab and press RUN:
WITH
  original_data AS (
    SELECT
      name,
      marks
    FROM
      distributed_computing
  ),
  aggregated_data AS (
    SELECT
      'Total' AS name,
      SUM(marks) AS marks
    FROM
      original_data
    UNION ALL
    SELECT
      'Average' AS name,
      CAST(SUM(marks) AS DECIMAL(10, 2)) / COUNT(*) AS marks
    FROM
      original_data
  ),
  final_data AS (
    SELECT * FROM original_data
    UNION ALL
    SELECT * FROM aggregated_data
  )
SELECT
  name,
  marks
FROM
  final_data;
Output:

Now save the new query as a dataset, and add it as a table chart:

If you want to make the Total and Average rows bold, or give a border, you can target them using css nth child like this: (Go to Edit Dashboard → Edit CSS)

However, if you want even more customization, you might have to write your own chart plugin. You could checkout:
https://preset.io/blog/building-custom-viz-plugins-in-superset-v2/#hello-world-v2
The Pivot Table chart provides a flexible interface where users can define rows, columns, and aggregations to organize and summarize their data. It supports various aggregation functions such as sum, count, average, and more, allowing users to calculate metrics based on their specific requirements. Additionally, it supports multiple levels of grouping, enabling users to drill down into the data and perform deeper analysis.
But ...
The Persistent Subtotals!


Apply metrics on Rows:
Thats all folks! If you want more insights, have questions or need help on data analytics or Apache superset support do reach out to us here and we can have a conversation.